What exactly does a technical project manager do?
If you’ve been in the field, you know that when it comes to software, technical project managers are the team behind resource allocation and planning – essentially, organizing and tracking all the work that each team will accomplish in a given cycle.
In my 5 years of experience in technical project management, I’ve found that the most effective teams work with technical project managers that are organized and detail-oriented, and most importantly, are supported by lightweight but effective internal processes.
At ServiceTitan, we plan and track our sprints almost entirely in JIRA, but of course, the tool could be any kind of planning tool. In this article, I’ll jump into what we’ve automated on the tracking process, and how to make sure you’re tracking the right metrics by showcasing Squad Metrics Report we maintain here at ST TPMO.
What’s in Our Squad Metrics Reports
Besides understanding how much we’re able to get done in a sprint, we also like to go a level deeper into what those activities are. As Senior Technical Project Manager, part of my role is to support my team in understanding where our gaps might be and what we might need to focus on next.
To put data behind that understanding, we report on what gets done (or doesn’t get done) every sprint. For transparency and visibility, we’ve standardized a fully automated dashboard for use across ServiceTitan – though the Squad Metrics reports are not shared companywide. We like to share the data only among the team – after all, the purpose of reporting is for our own improvement and discussion during retrospectives and sprint reviews.
In short:
- The report is for the eyes of the specific team only
- It is meant to be used to identify gaps in the way the team operate and opportunities for improvement
- It is meant to be a discussion starter for the team
The report is not for…
- Pointing fingers
- Measuring performance by team member
- Used to compare teams and present to management
Currently, we look at two major sections of data: Sprint level data and Release level data.
Sprint Level Data
- SPs at end of Sprint: Story Points available when the sprint was closed
- SP completed: Story Points that were moved to the status Done during the sprint
- % of committed SPs Completed: Out of the Story Points completed during the sprint, the number of which were added during this sprint (rather than being carried over from the previous sprint)
- Dev Completed Points: Story Points that were moved to Review status, but have yet to be completed by QA
- SP Carried Over: Story points carried over to the next sprint
- QA D to Story: Ratio of QA Defects to Story tickets available in the sprint. This shows for every Story Ticket the team was working on, how many QA Defects were generated
- New Dev Capacity %: Percentage of the team’s capacity allocated to new development (Stories/Dev tasks) vs maintenance (Bugs/QA defects)
- Avg Tickets size: Average story ticket size in the sprint
- Unplanned SPs: Scope creep in story points
For each metric, we study across 3 timeboxes:
- Previous sprint: shows data for the most previous sprint
- 2020/2021 average: shows data for each metric averaged out for the 20-21 years
- Rolling Average: shows data for each metric averaged over the past 3 sprints. This gives a more accurate idea of the team’s health
To better highlight trends, there are 2 columns that give an idea of where we are headed:
- Trend: Compares the rolling Average to the 20-21 average
- Sprint Performance: Compares sprint data to Rolling Average
These trends are based on the standard deviation of the metric over 20-21. If the sprint number is within 1 standard deviation of the average, it marks ‘within average’ in the trends.
Otherwise,it will show ‘Up!’ or ‘Down!’.
These trends provide context for our discussions during the retrospectives and sprint reviews. We study each metric across three timeboxes – 2020 Average, Rolling Average, and the previous sprint.
We rely on these metrics during retrospectives to understand if there is something we should improve. If there is, the detailed metrics help us think about how to improve and what, specifically, can help us do better.
Release Level Data
In addition to Sprint Level Data, we also track data based on each release. This helps us track how the team did on the current and past releases.
If the total number of bugs has increased compared to the last release or compared to the avg. number, we discuss that during retrospectives to understand why, find the root cause, and also understand how this number can be improved.
For now, the data we track contains bugs for the current release, the previous release, and the 2020 average grouped by:
- Total number of bugs
- Bugs found by QAs
- Bugs found by Customers
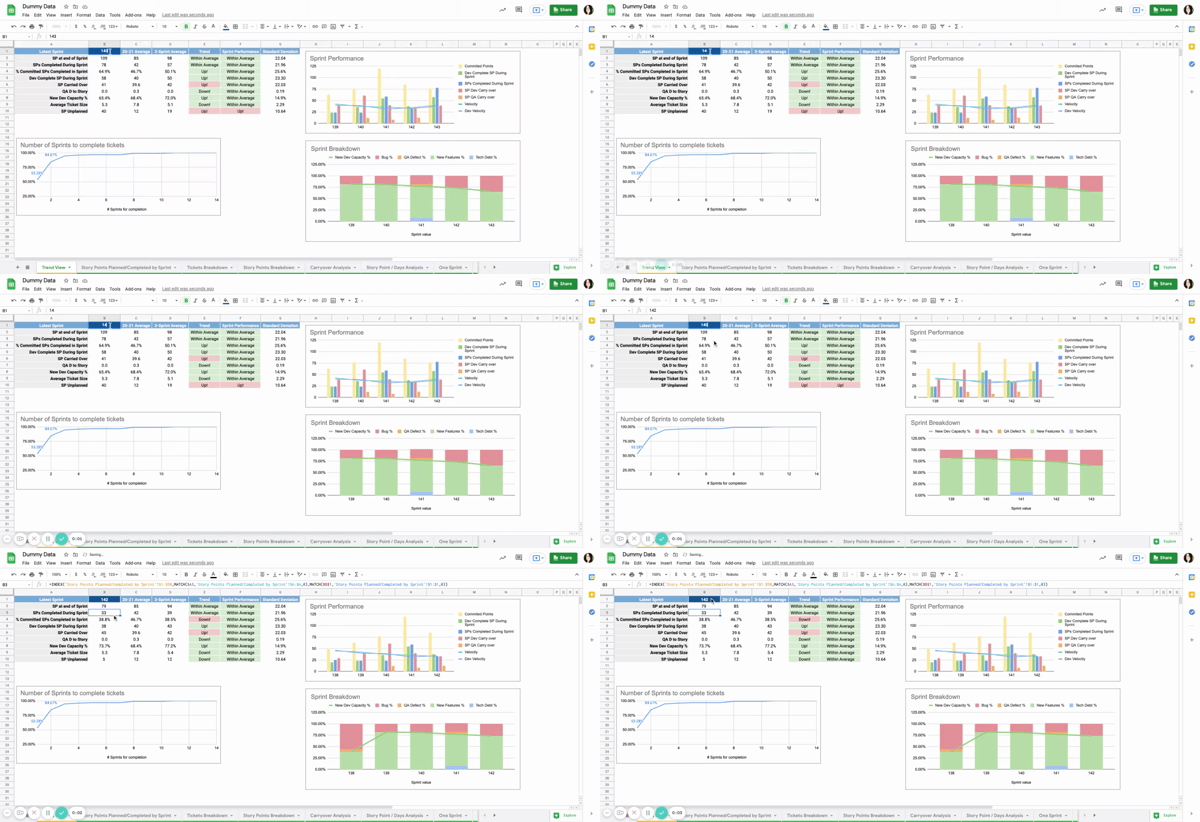
And, magic! Check it out:
The data we get from Jira is dynamically updated based on the schedule we set up, so you can have an idea about how your team is doing at the mid of the sprint/release by taking a look at the sprint/release level metrics.
As you can see, being a Technical Project Manager here at ServiceTitan is unique in that we’re provided with an excellent template to do our work, and with that, we’re able to make data-driven decisions on what to do next.
BIO
Karine Tavrizyan is a Lead Technical Project Manager at ServiceTitan. She’s been on the team for more than two years, and her favorite thing about working at ServiceTitan is the flexibility and the freedom to innovate and grow. When she’s not at work, you might find her playing tennis or watching movies – or maybe just reading fiction – that’s her favorite hobby.

